


Over 70,000 users worldwide use ViewsHub, from organizations including:
Blending data, AI, and human insight on behaviors and performance, to predict interactions, preempt challenges and boost

Our goal:
Our goal is to supercharge 1-to-1 and team interactions,
by transforming behavioral traits into predictive data

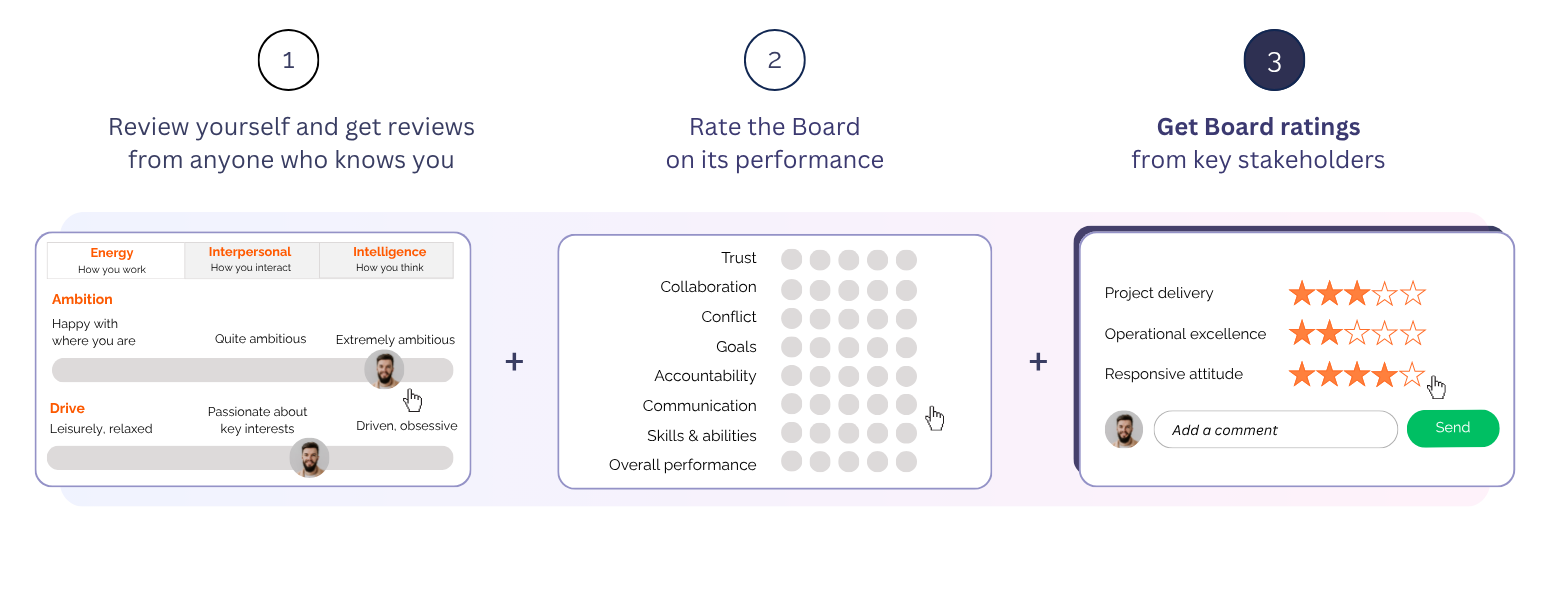
What you do:
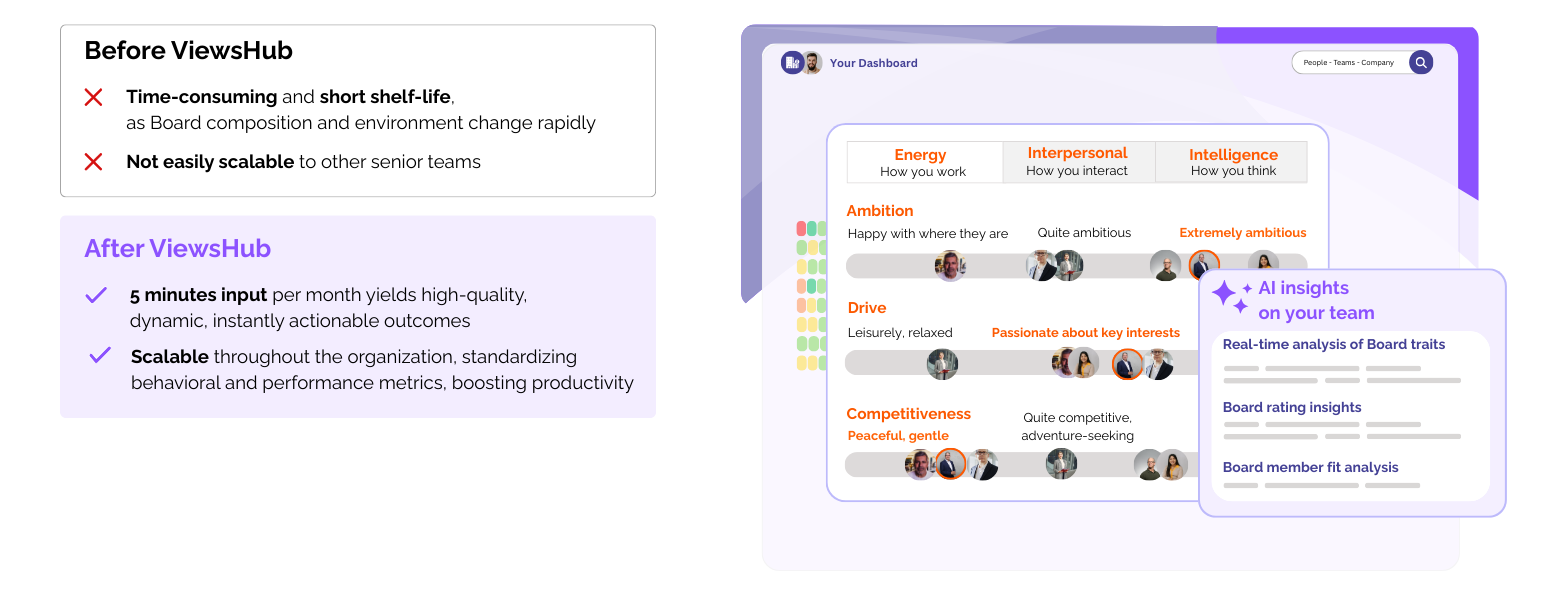
5 minutes input per month, per Board member
5 minutes input per month, per Board member
Review yourself
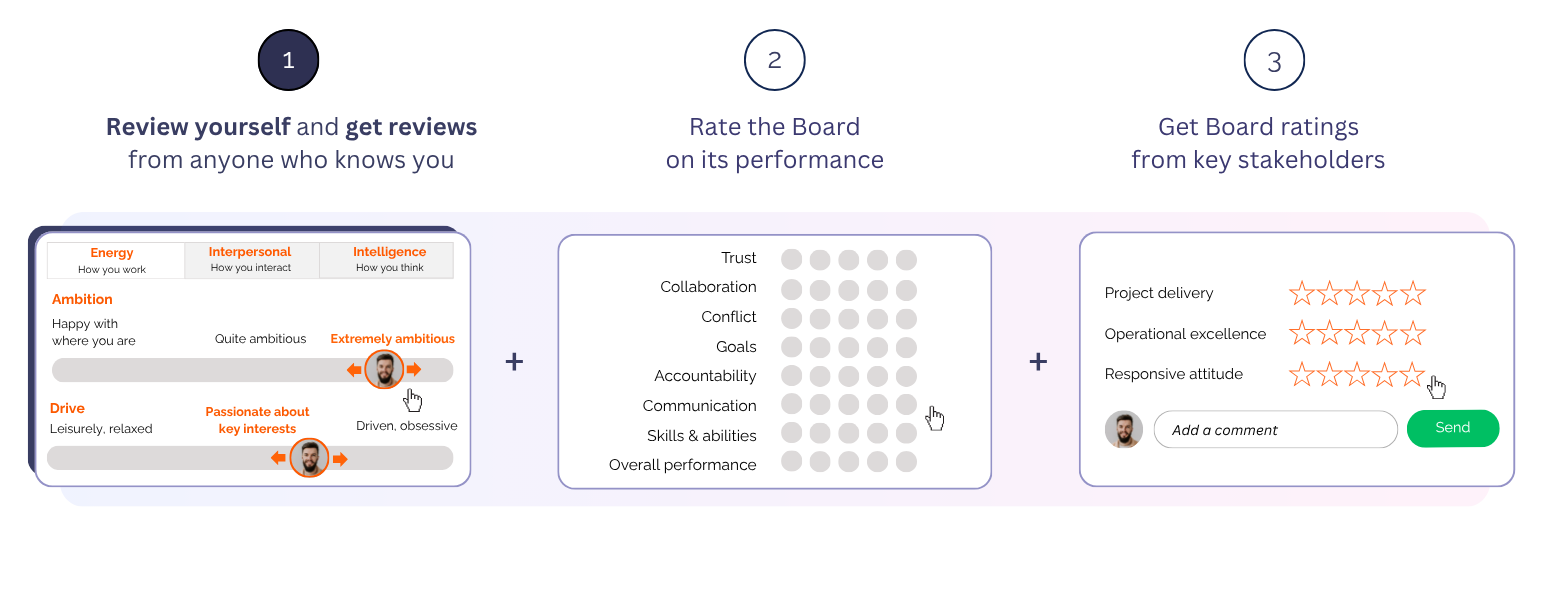
Rate your team
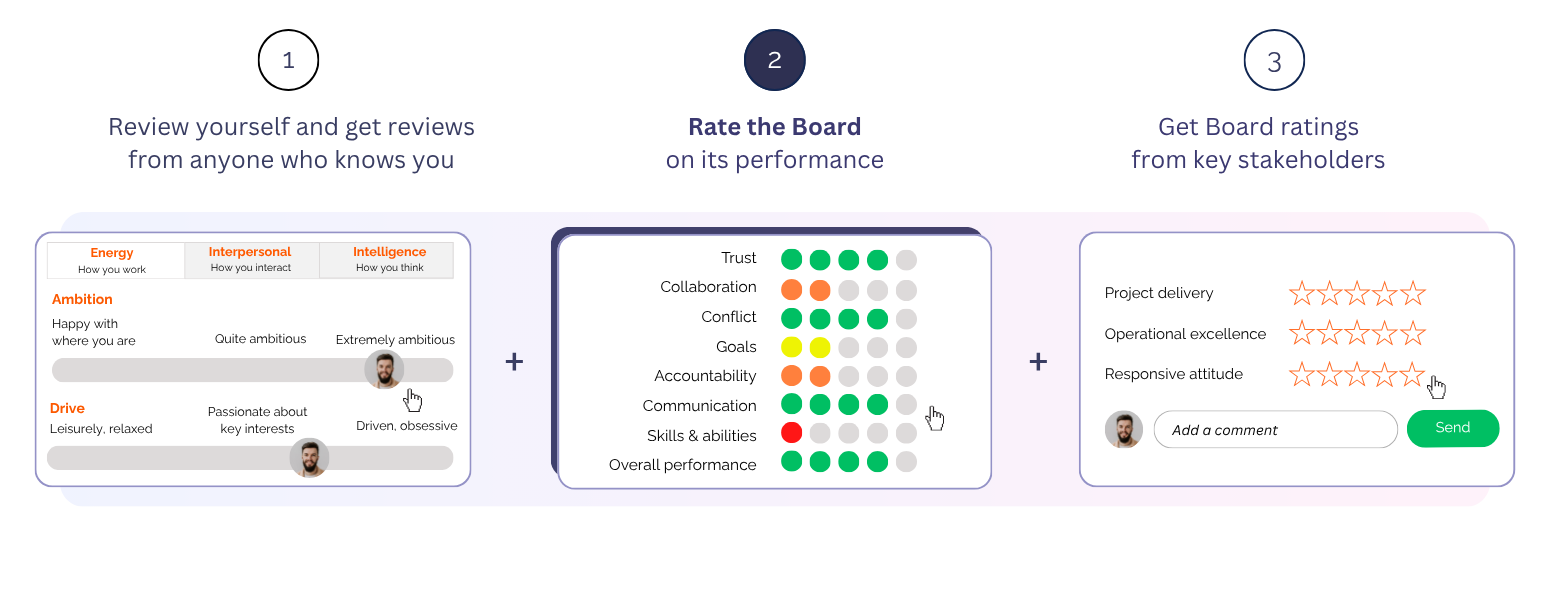
Get team ratings
The Statistical Analysis
ViewsHub is a crowd-sourced profiling tool to help users better understand how they are perceived. It is not a "black box" psychometric test. It is also highly customisable for companies to add their own measures of values, culture or traits that they would specifically like to measure within their organization. However, with the large dataset we already have, a statistical analysis of the data already uncovers strong relevance and consistency with existing psychological frameworks.
The traits we measure (based on the generally accepted "OCEAN" psychological framework) are our standard ones that we use to compare team members with each other in the TeamDNA map and analytics tools.
The trait scales are statistically validated based on a combination of analyses on both correlations between the traits and standard deviations within each trait, using the data from 70,000 users.
Correlations
These highlight that of all the possible correlation pairs, over 80% have correlations of less than 0.3 (very little correlation), 19% are 0.3 to 0.6 (low to moderate correlation) and 0% are above 0.7.
The highest five correlations are all 0.51 to 0.56, which is not too high. They are:
• A few close friends with Reserved
• Consensual with Mild Mannered
• Consensual with Peaceful/gentle
• Mild mannered with Reserved
• Focused on self with Saying anything to get things done
Whilst the first four are predictable, the last one was a bit more of a surprise!
Averages / Standard deviations
These showed that the trait terminology is working well in capturing a range of results.
• With a scale out of 200 across each bar ie 100 is the centre point, average scores for all users combined were within 25 of the centre point in all cases, ie there are no bars where results are heavily weighted to one side.
• The standard deviations on each bar were between 35 and 43. So there is a good spread through each bar without any being especially tightly clustered or too far away.
If you want to add your own bespoke measures of character or company values etc, you can do so as a premium user once you have got to your homepage.

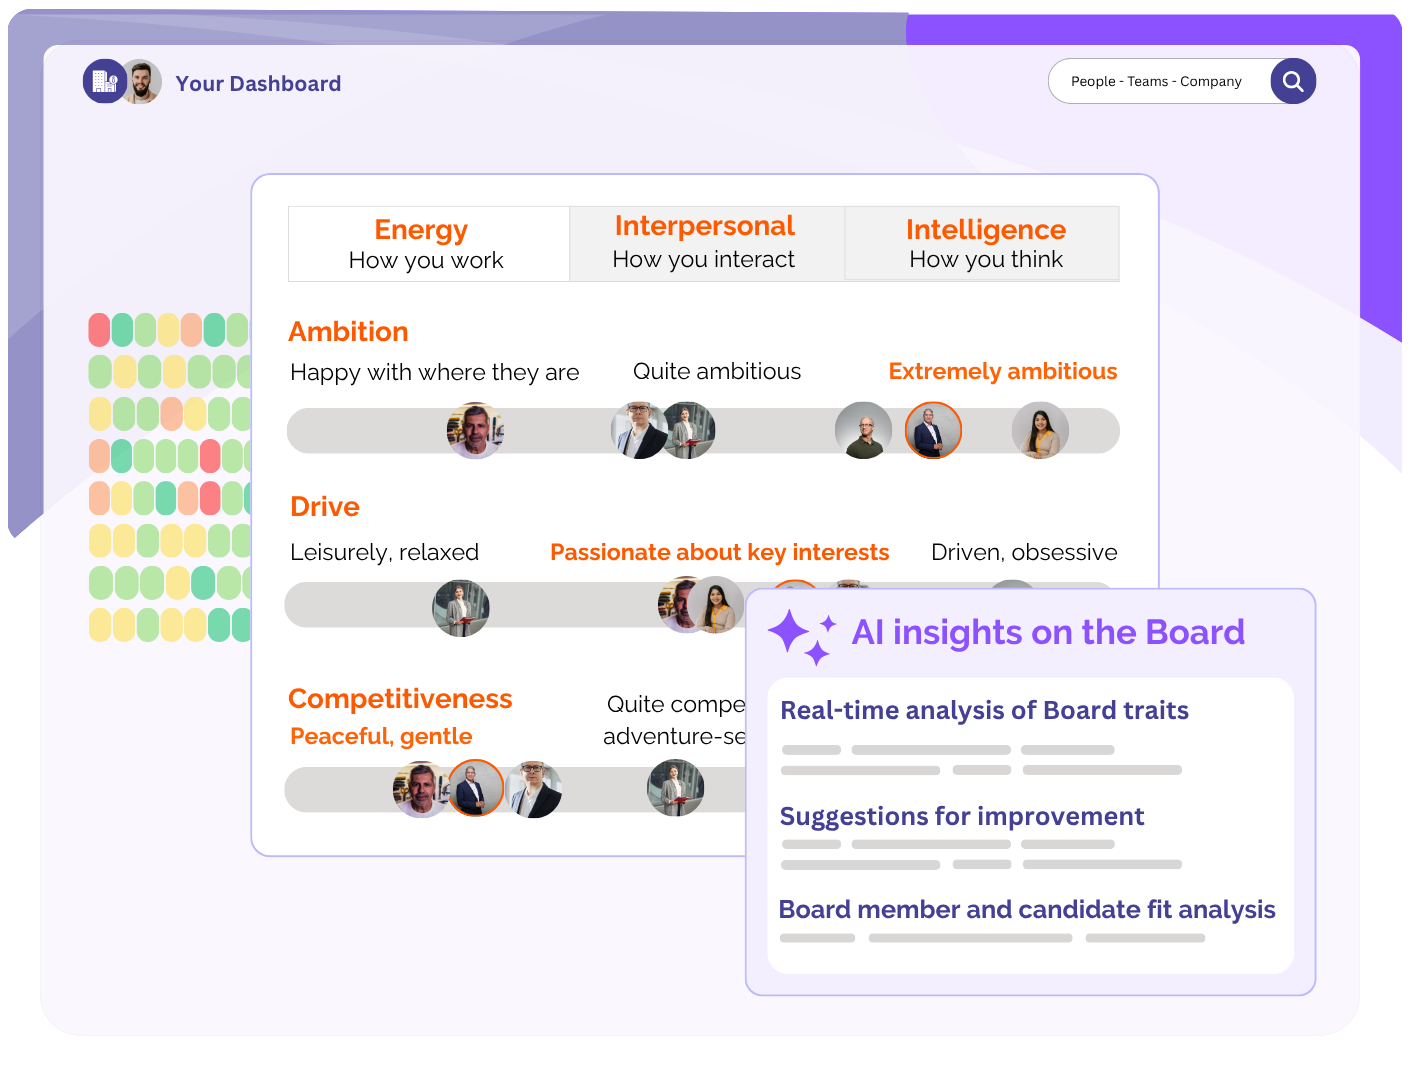
What you get:
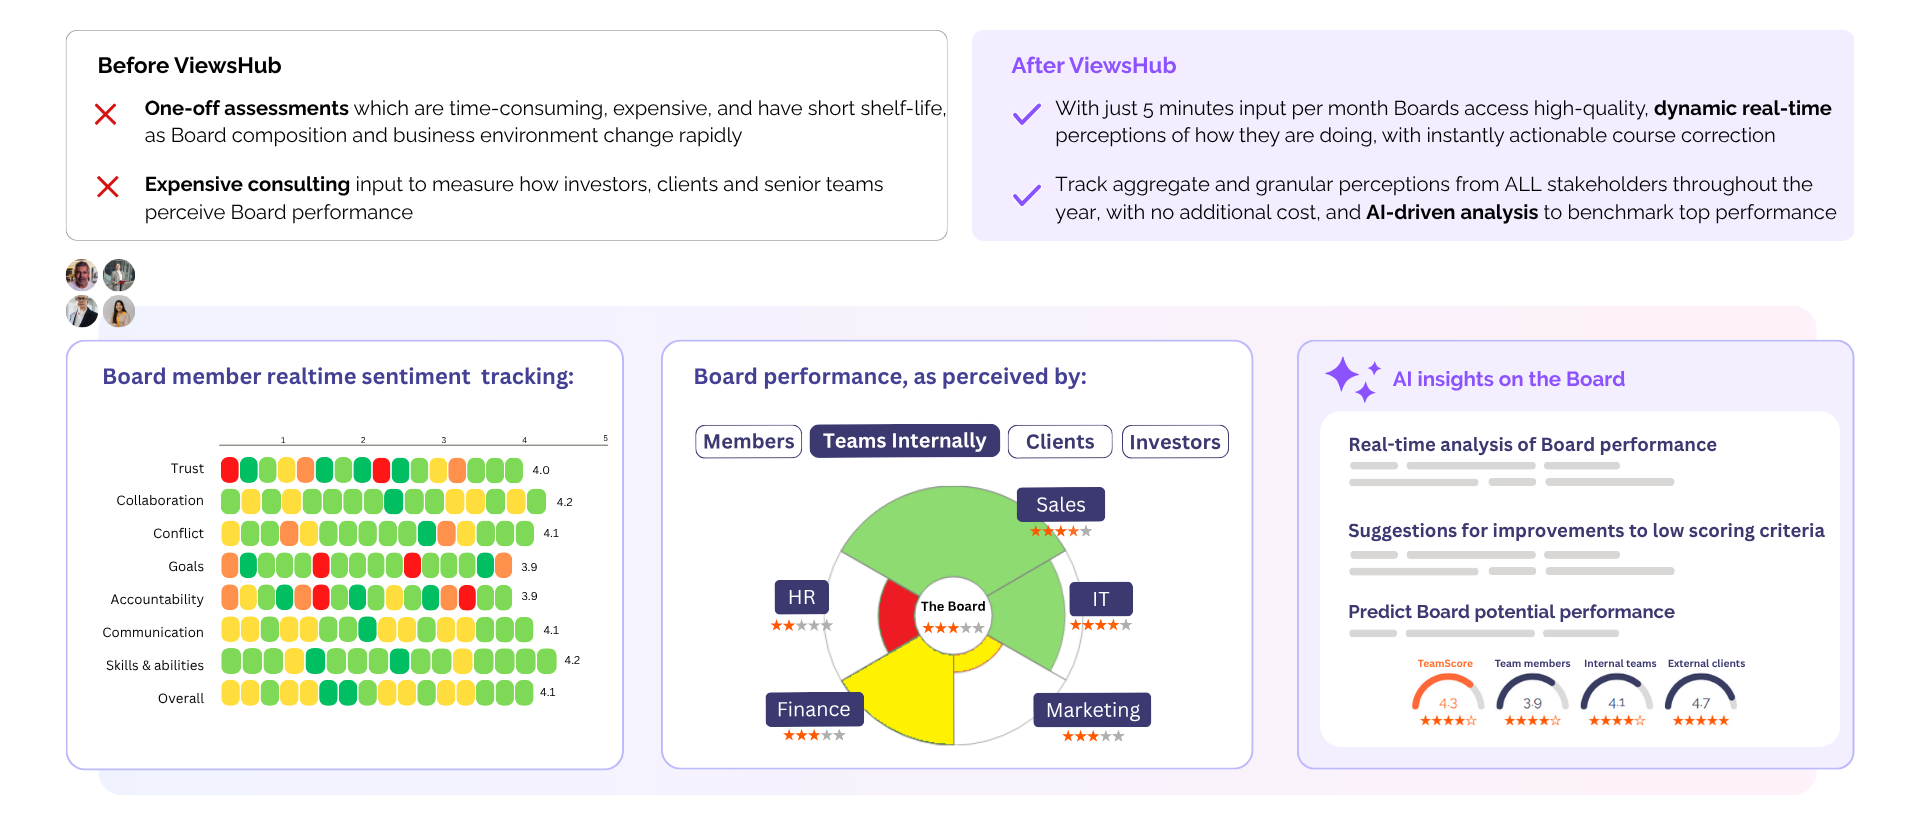
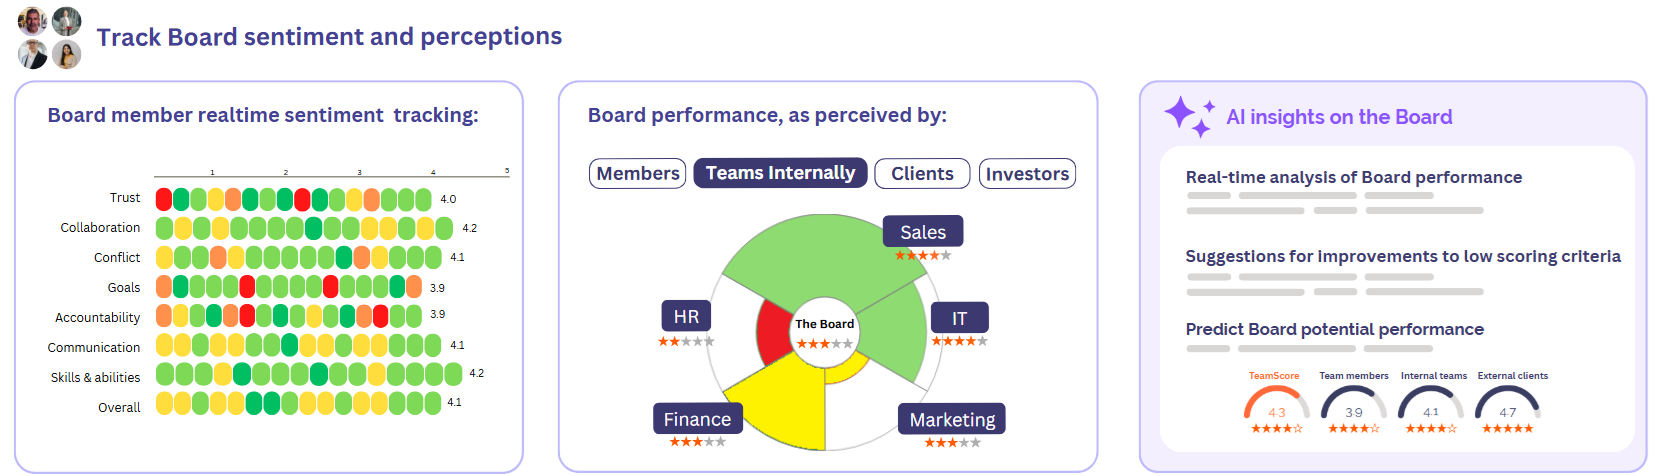
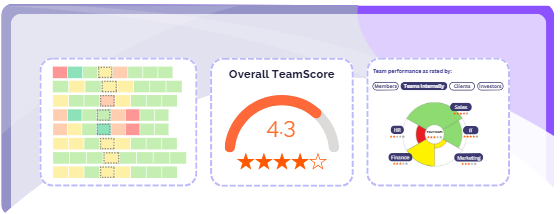
Track Board sentiment and perception
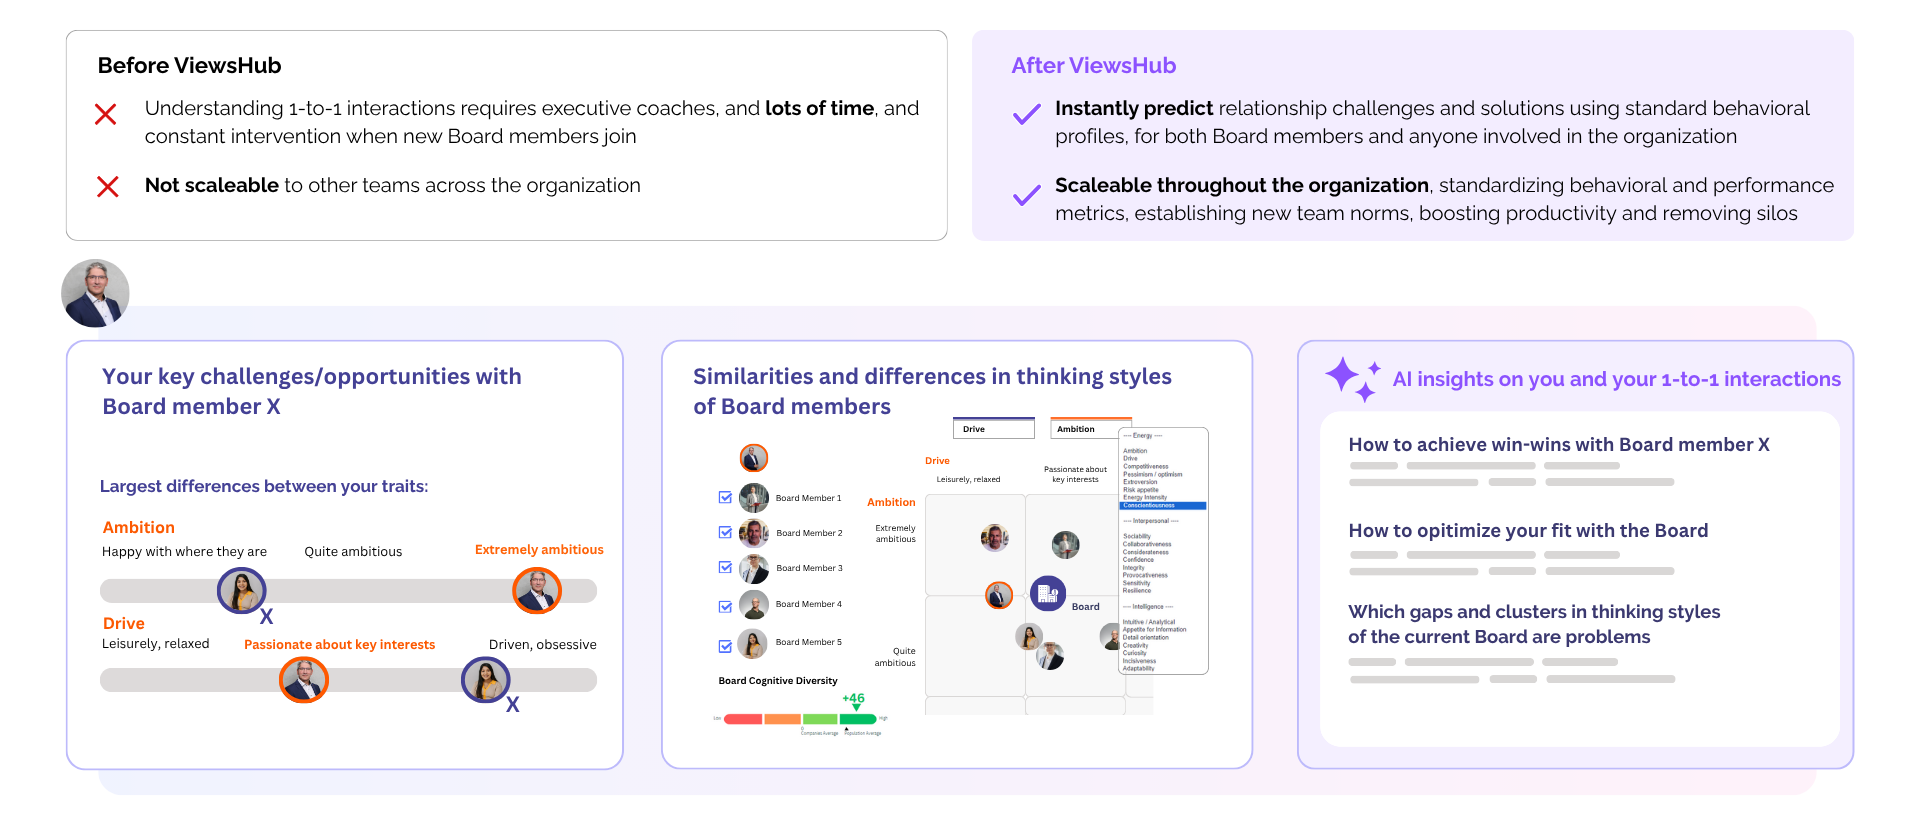
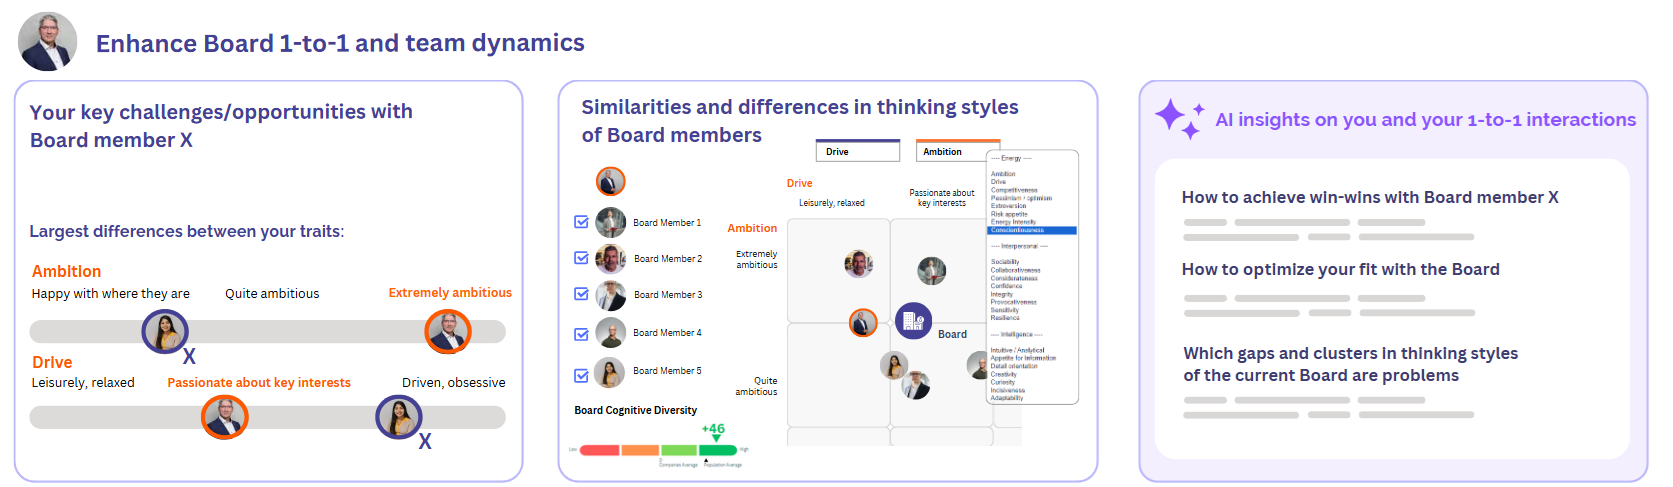
Enhance Board 1-to-1 and team dynamics
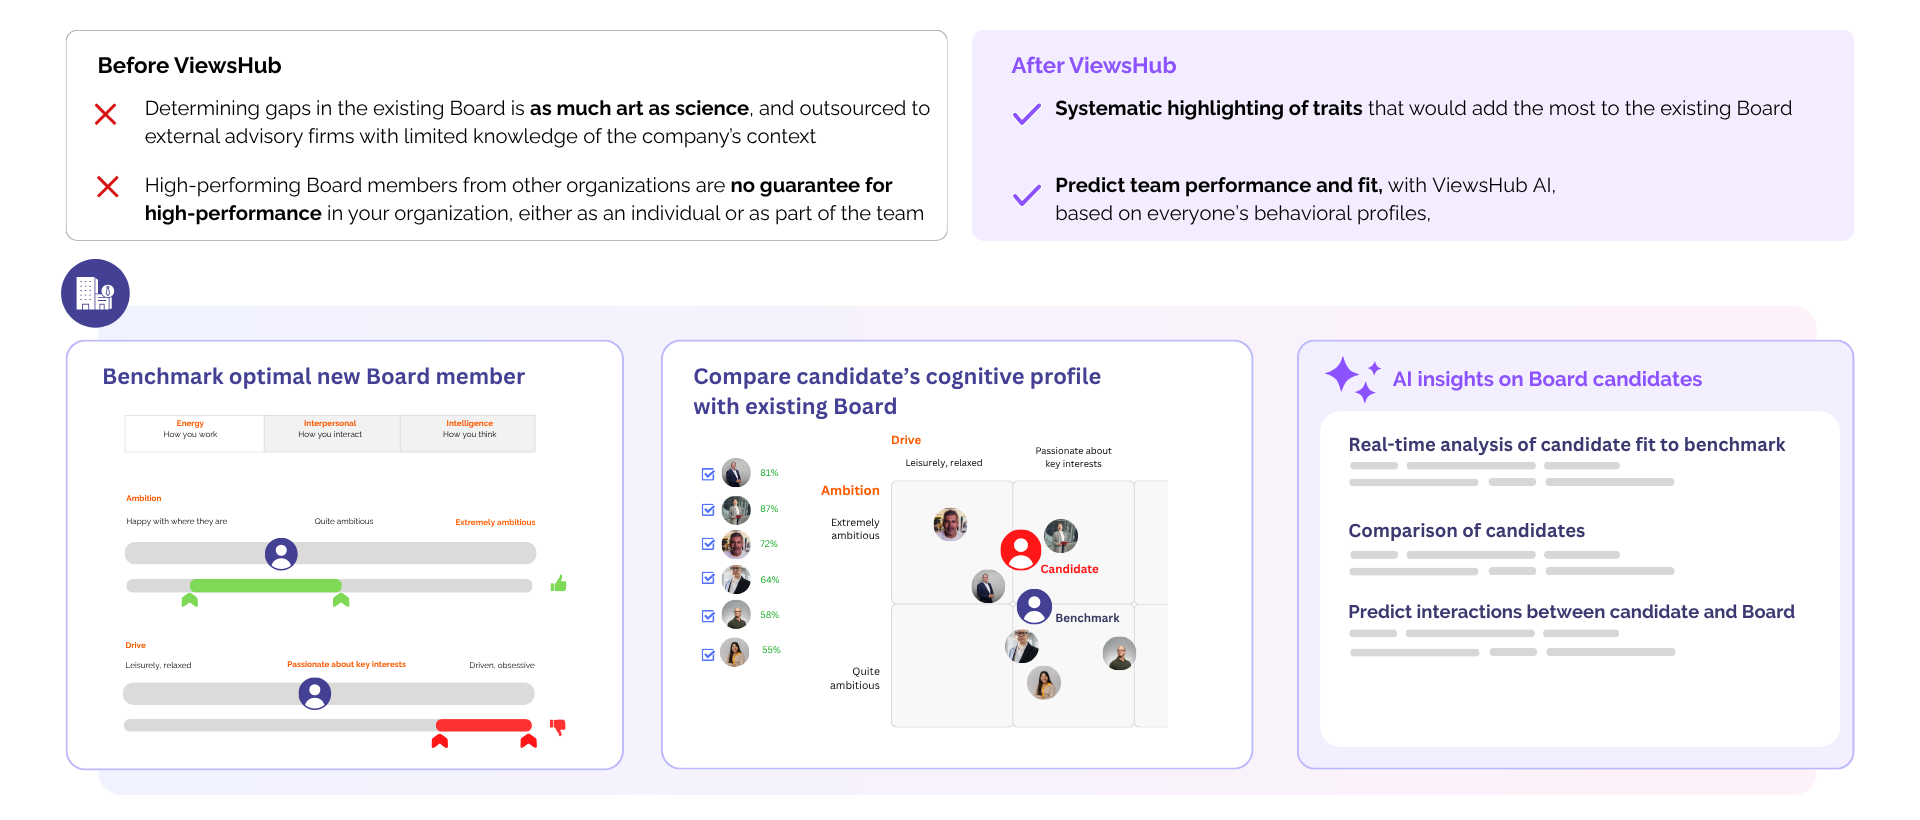
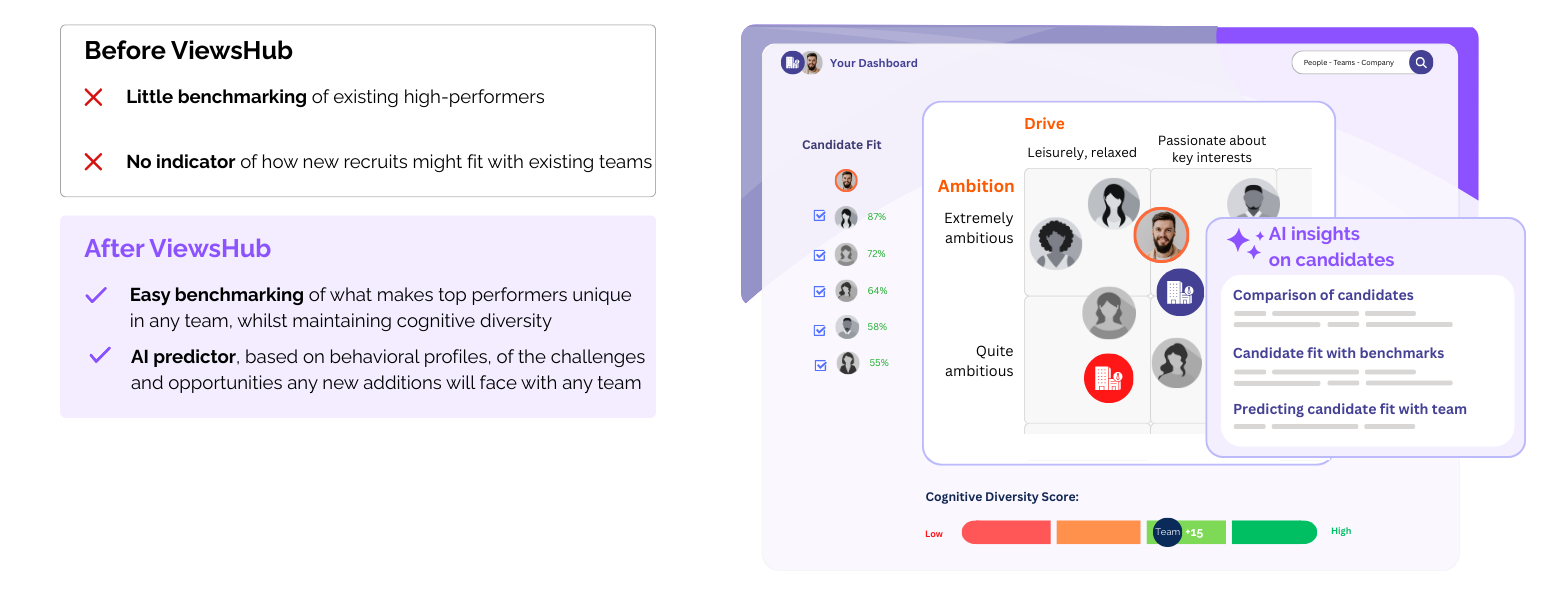
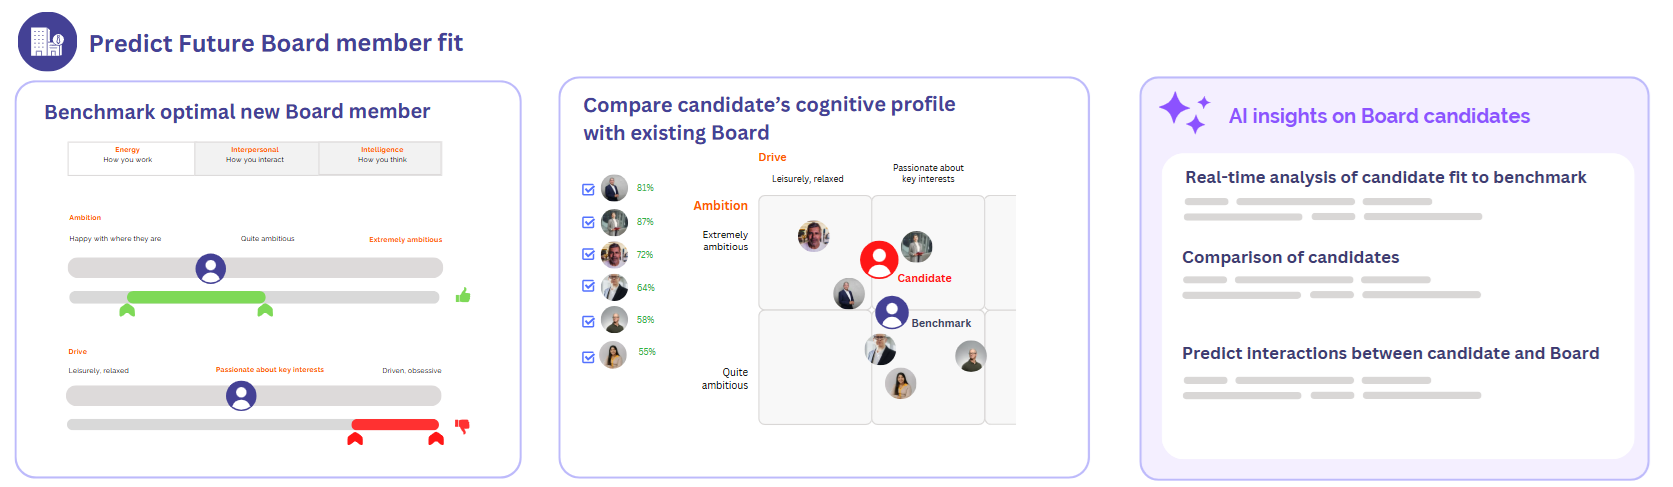
Predict Future Board member fit

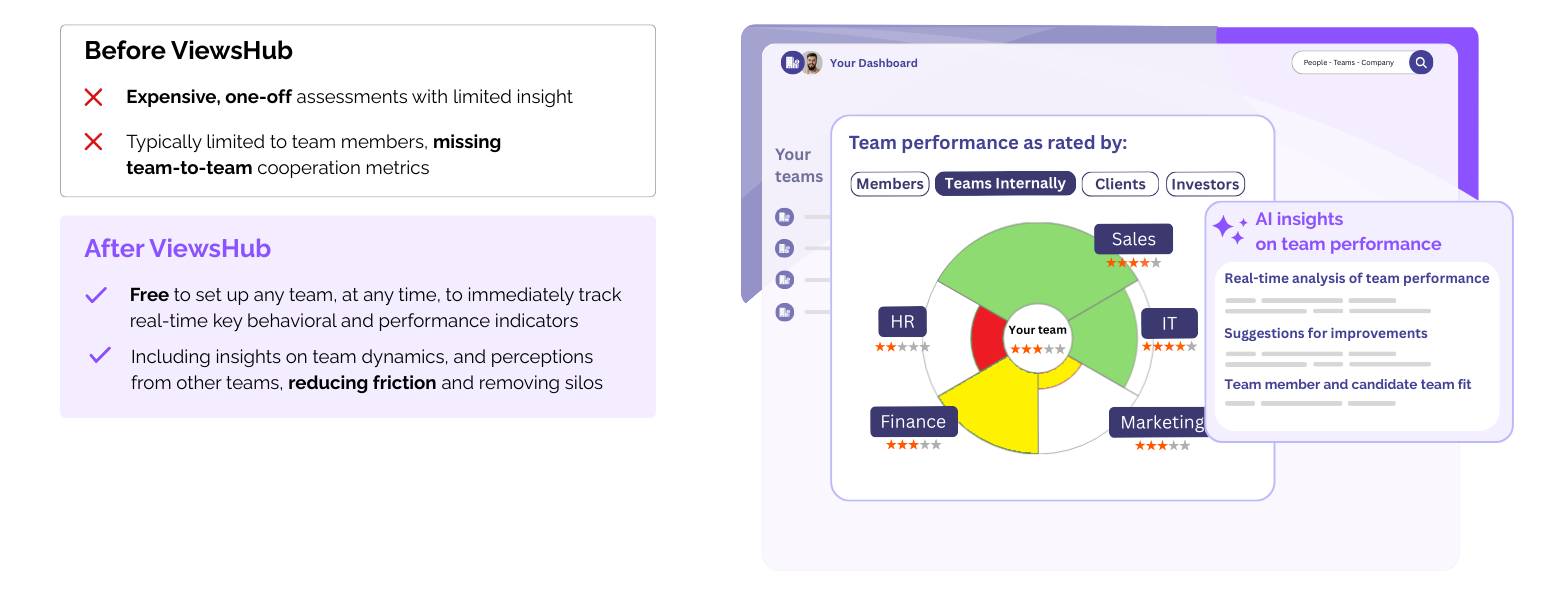
What ViewsHub transforms:
Team Dynamics with Rapid Real-time Team Assessments
Board Dynamics with ongoing Board Assessments
High-Performer Benchmarking and Recruiting
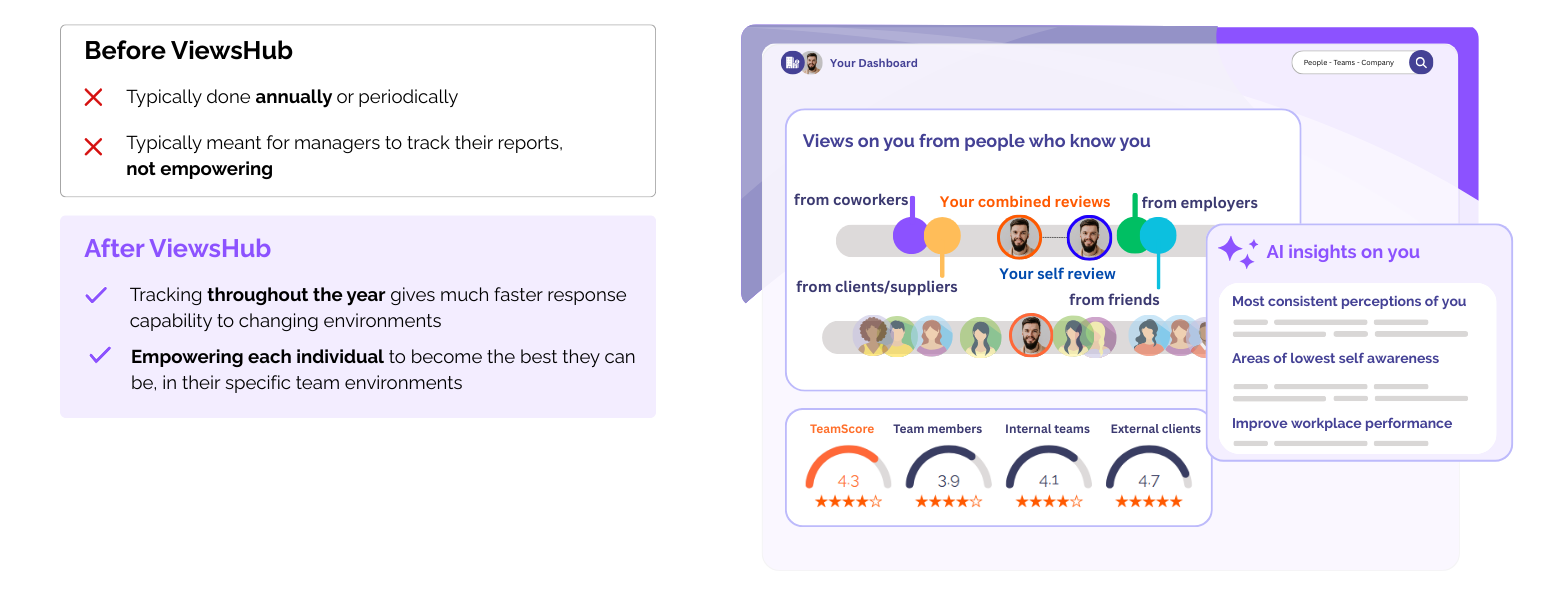
Real-time 360 Appraisals of behavior and performance
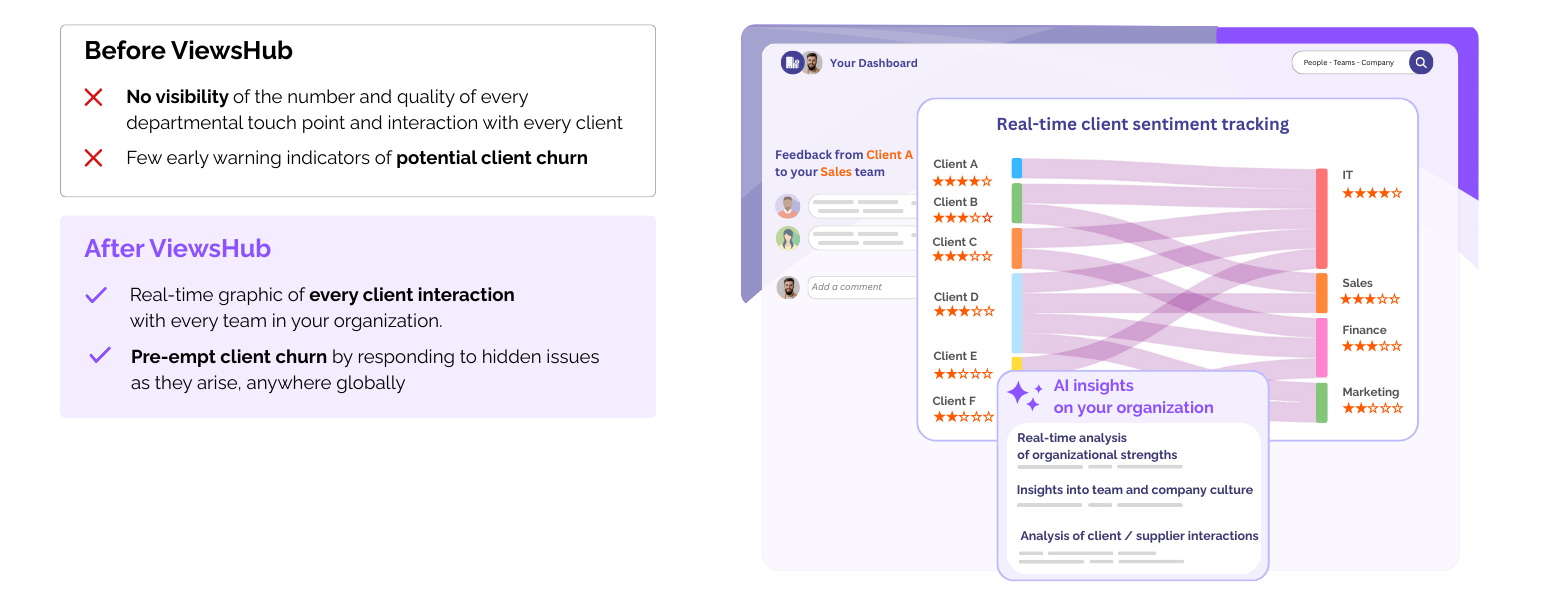
Client Empowerment with Active CRM
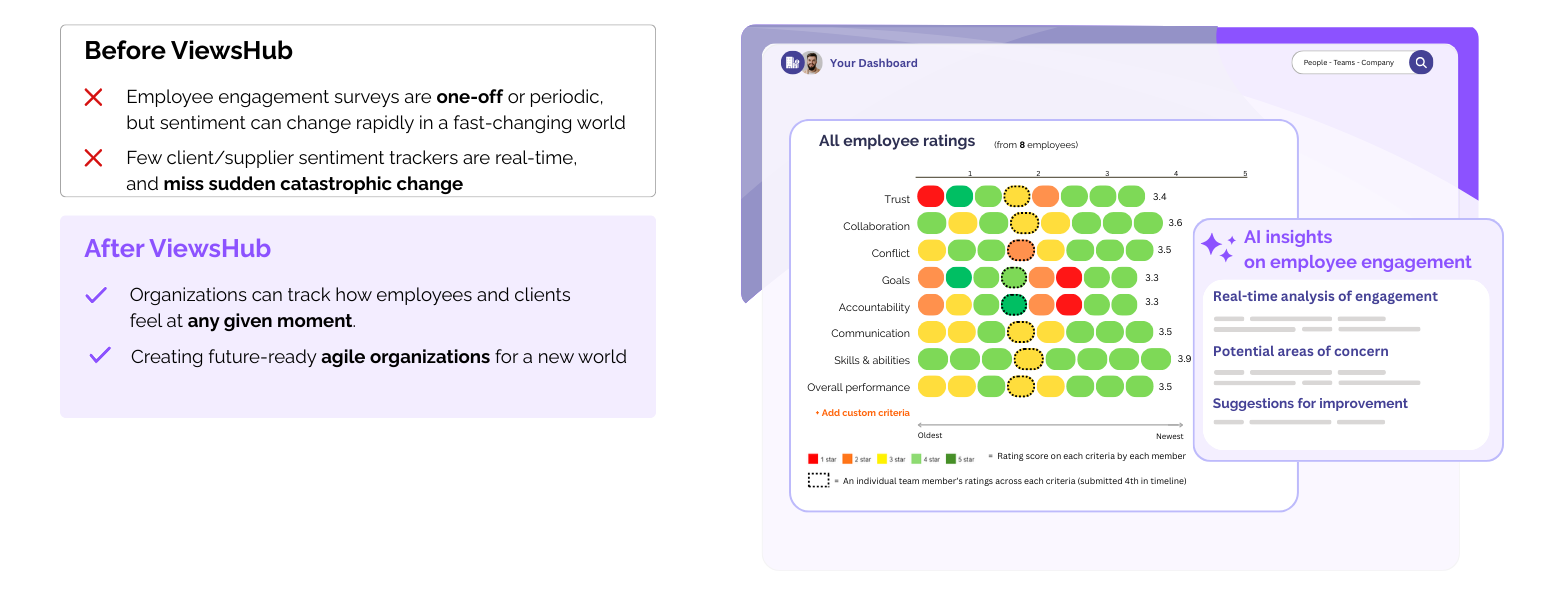
Live Employee Engagement tracking
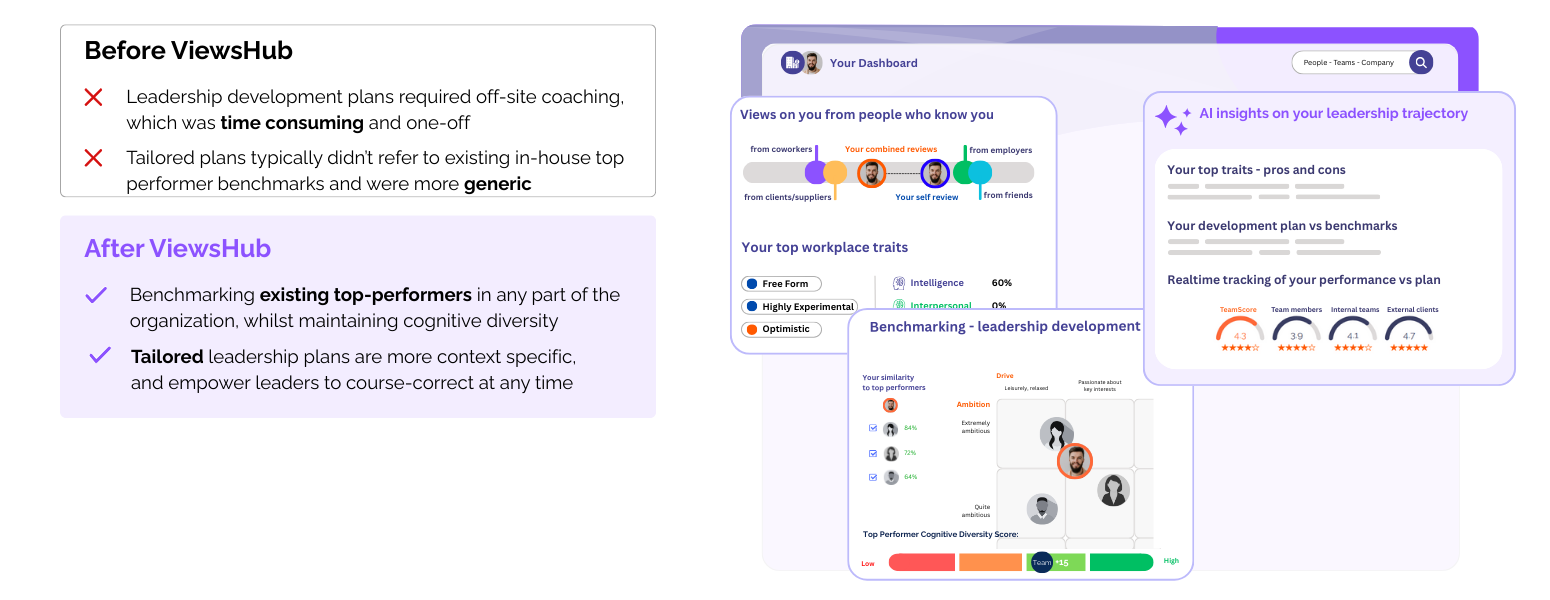
Organization-wide Leadership Development

Sign Up instantly
Free for Boards of any size
Premium options available
Decentralized network of teams, rapidly adapting, intensely client-focused
No friction • no silos • no client churn • no deadening hierarchies
* The science behind the traits
Premium options available
Decentralized network of teams, rapidly adapting, intensely client-focused
No friction • no silos • no client churn • no deadening hierarchies
* The science behind the traits
Privacy as standard
Complete control at every level

Complete control at every level
Multi-platform
Desktop, Mobile, App

Desktop, Mobile, App
GDPR Compliant
Enterprise-grade data protection

Enterprise-grade data protection
User support
We're here to help

We're here to help